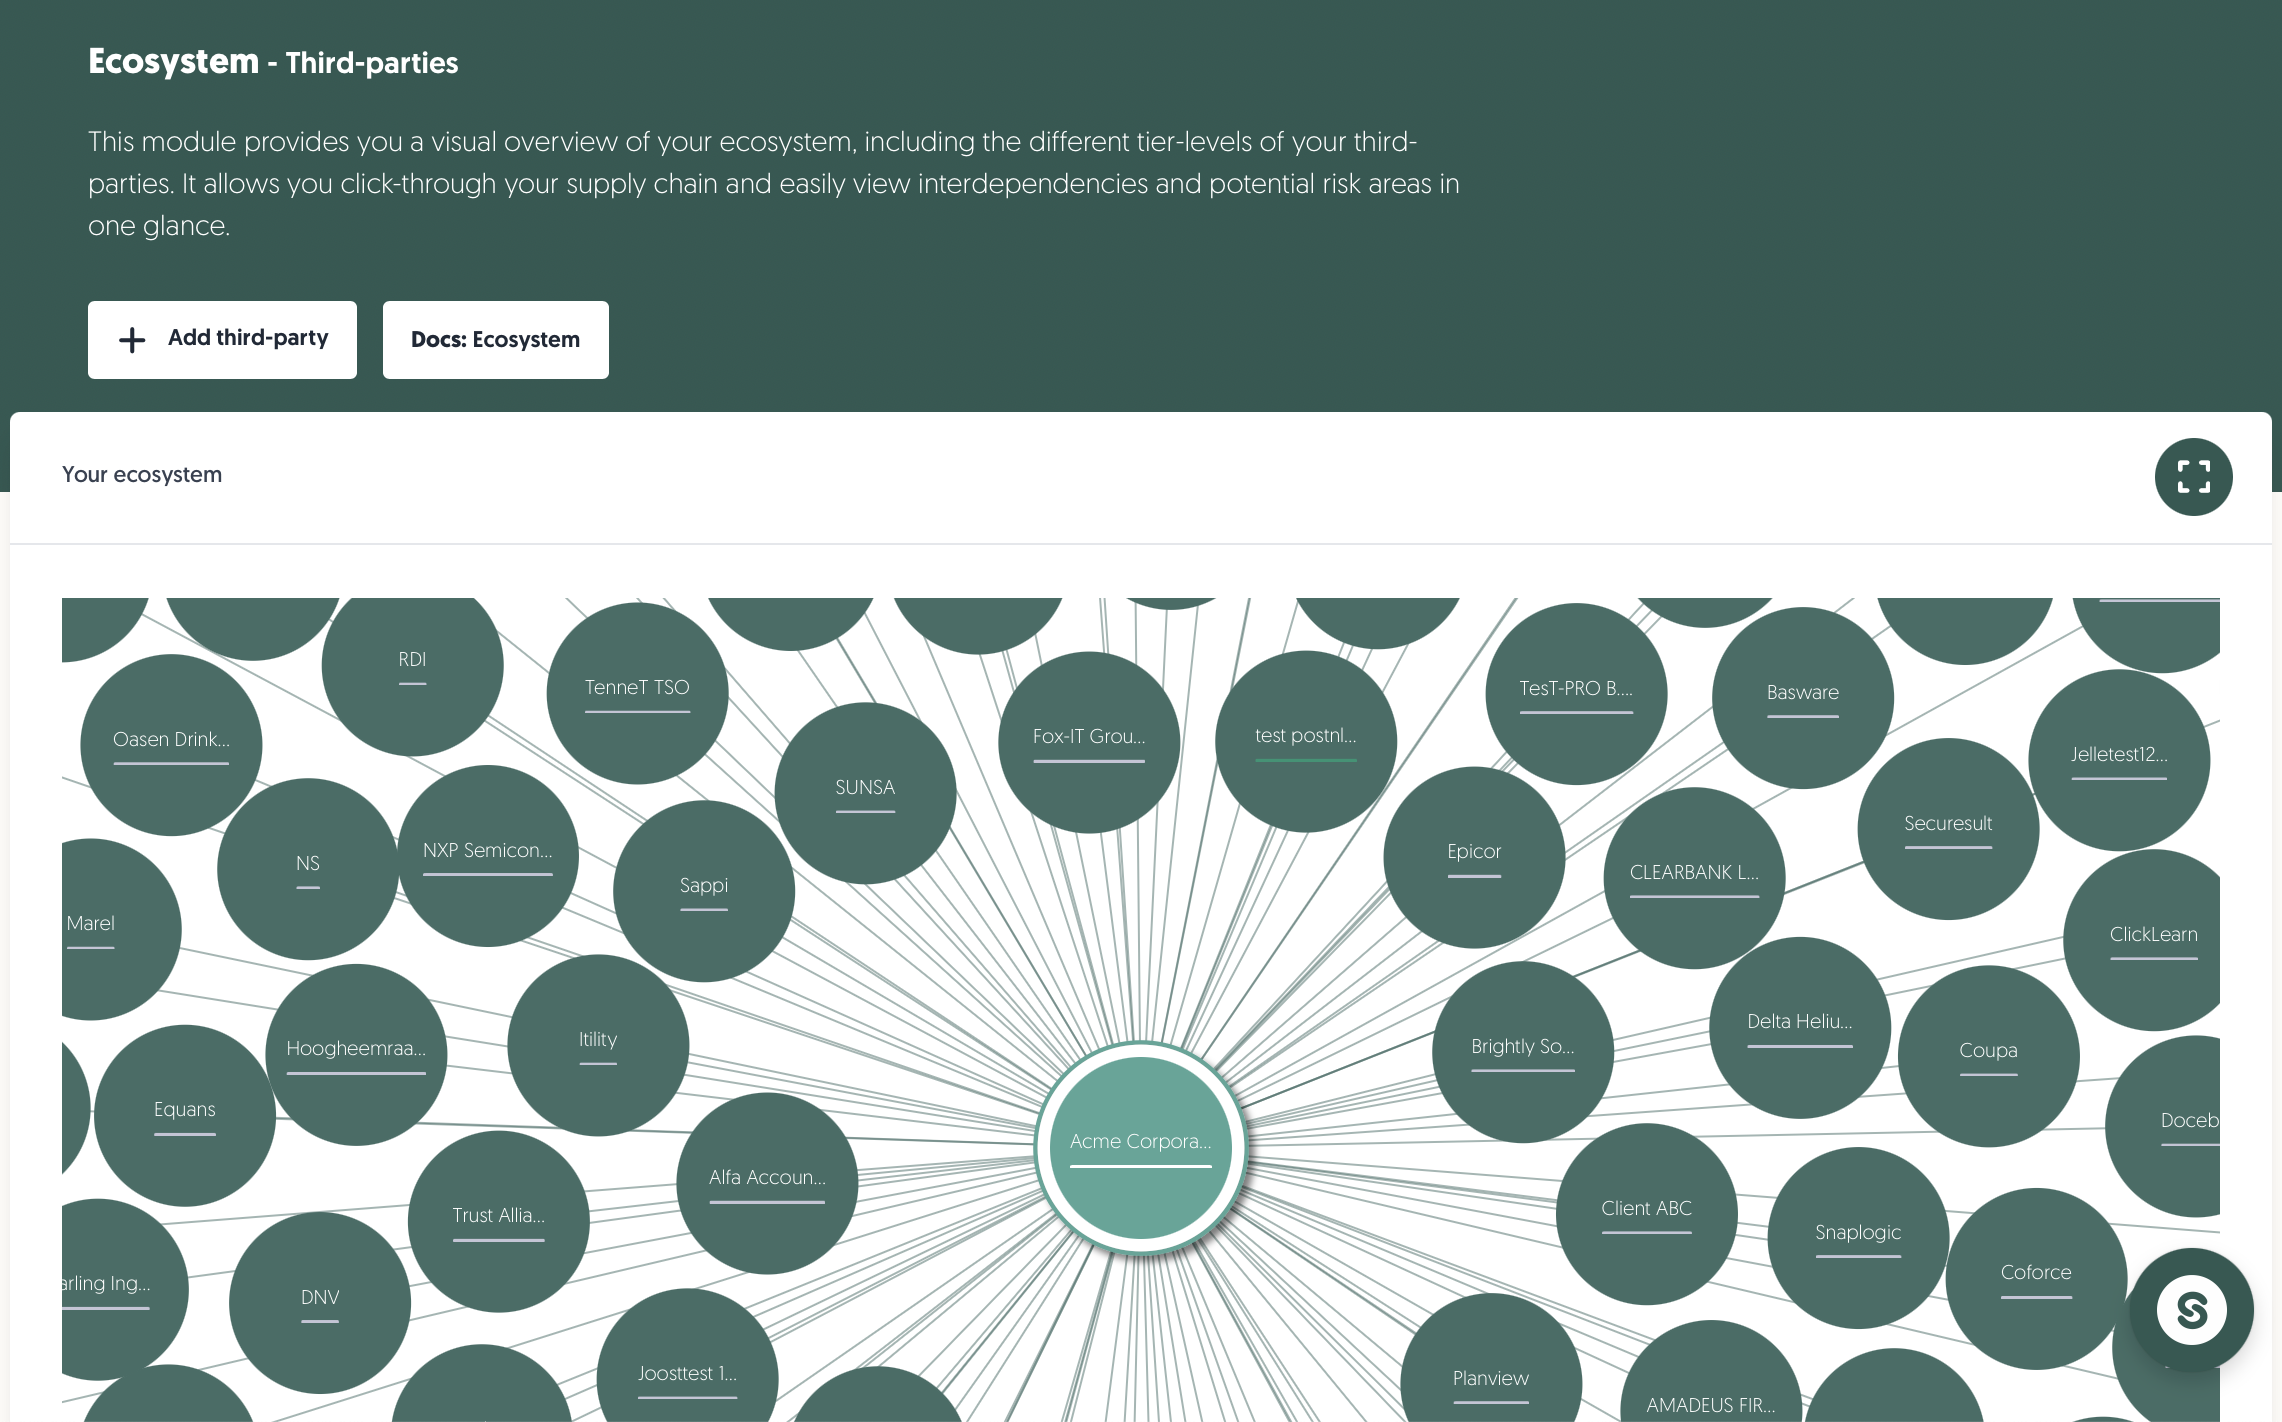
Ecosystem
This ecosystem diagram provides a visual overview of your third-parties, including their tier levels. It allows you to click through your supply chain and easily view interdependencies and potential risk areas in one glance.
Overview
On the ecosystem page, you will find the ecosystem diagram. At the top of the page, you also find the + Add third-party button. Additionally, Docs: Ecosystem leads to this article.
Learn more about adding third-parties here: Add third-party
Diagram
The ecosystem diagram visually represents your network of registered third parties and their relationships to your organisation. Click on your organisation to view your ecosystem. Use the full-screen mode to see more details about your ecosystem:
- The colors of the circles indicate tier levels. Tier 1 represents direct relationships, while Tier 2 and beyond reflect indirect connections.
- The line under the third-party name represents the associated risk profile from green (lowest) to dark-red (critical). A grey line indicates that the risk profile is pending.
- Third parties with a double-colored edge have indirect Tier 2 (or higher) connections. Click on them to explore these sub-contractors.
- Use the filter and search bar to quickly find specific third parties, tiers, or connection types within your ecosystem.
- The platform automatically generates the diagram and continuously updates based on the latest changes in your third-party catalogue.
Learn more about the third-party catalogue here: Third-party catalogue
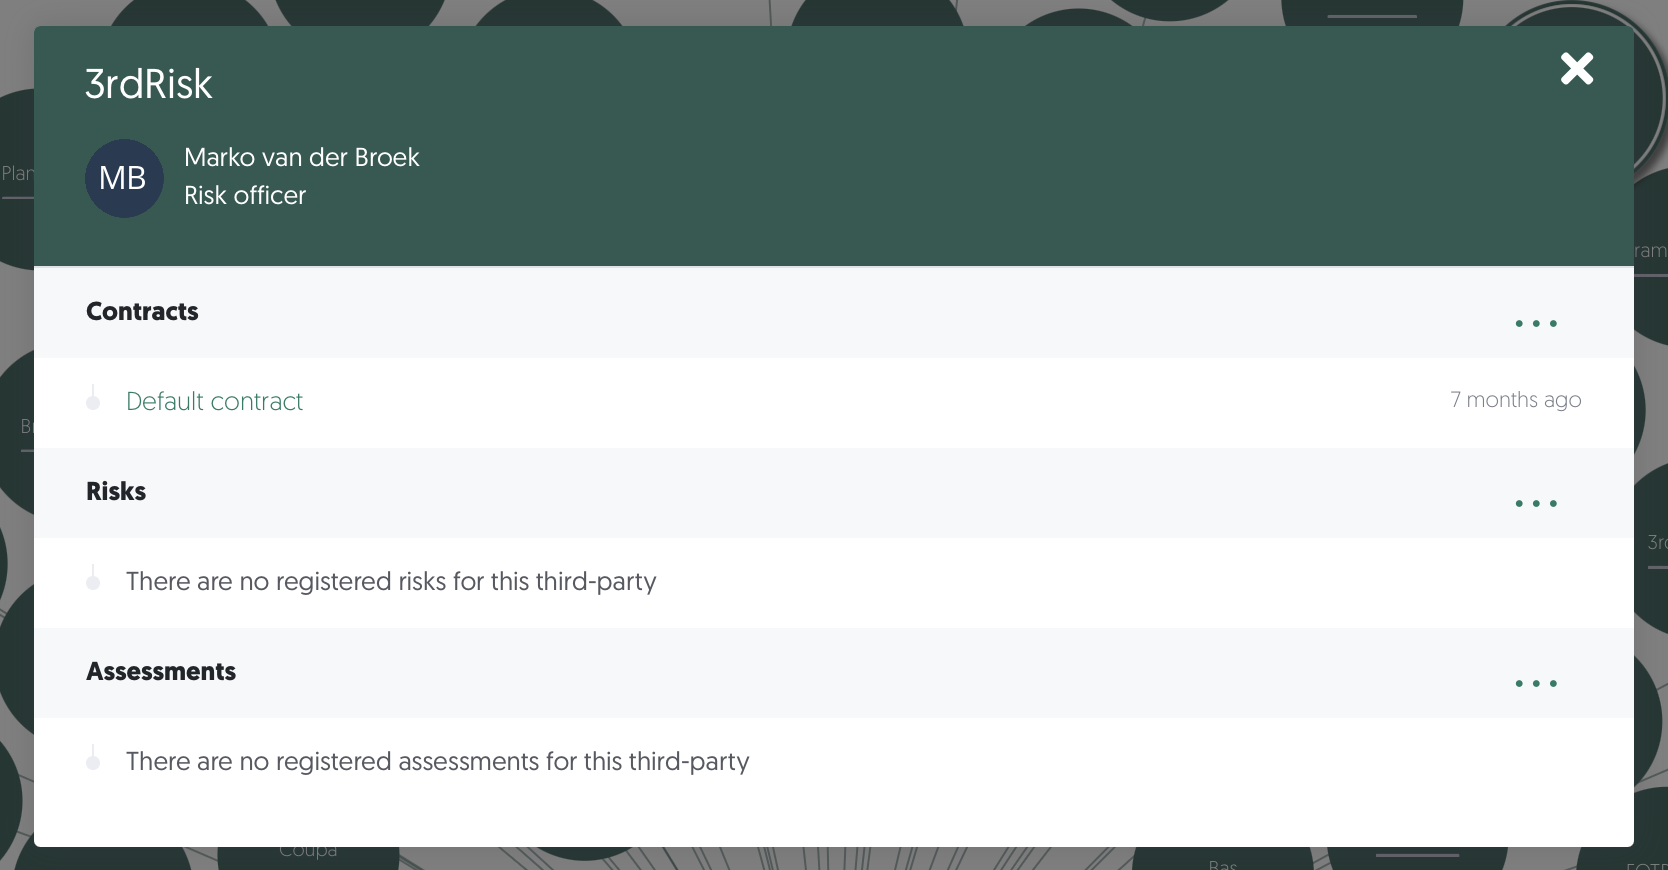
Third-party details
Double-click on a third party to view the following details of this third party. Via this overlay, you can directly view the involved stakeholders, all associated contracts, risks and assessments. Using the ••• button, you can view in more detail or quickly add new contracts, risks or assessments related to the third-party.