
Dashboard
The dashboard provides you with an actionable overview of key metrics. By default, the platform ships with an interactive dashboard that enables you to explore and navigate through every granular level of your data.
Overview
The dashboard consists of the following components from top to bottom:
- World Map: A dynamic, interactive world map that visually represents the geographic distribution of your third parties.
- Checklist: A list of steps to take to setup the platform. Currently only applicable to DORA compliance add-ons.
- Activities: Track and tackle items that require your attention, such as action plans, issues, and assessments.
- Senses & Integrations: Track the latest changes to your third party's cybersecurity ratings, credit ratings, and sustainability scores. View overall ecosystem ratings and scores.
Available from Insight plan. - Ecosystem: Get strategic insights into your ecosystem for third party risk management. Track issues, risk exposure, and other operational metrics, as well as their performance.
- Internal Control: View the most important metrics related to compliance management.
Available from Manage plan.
World Map
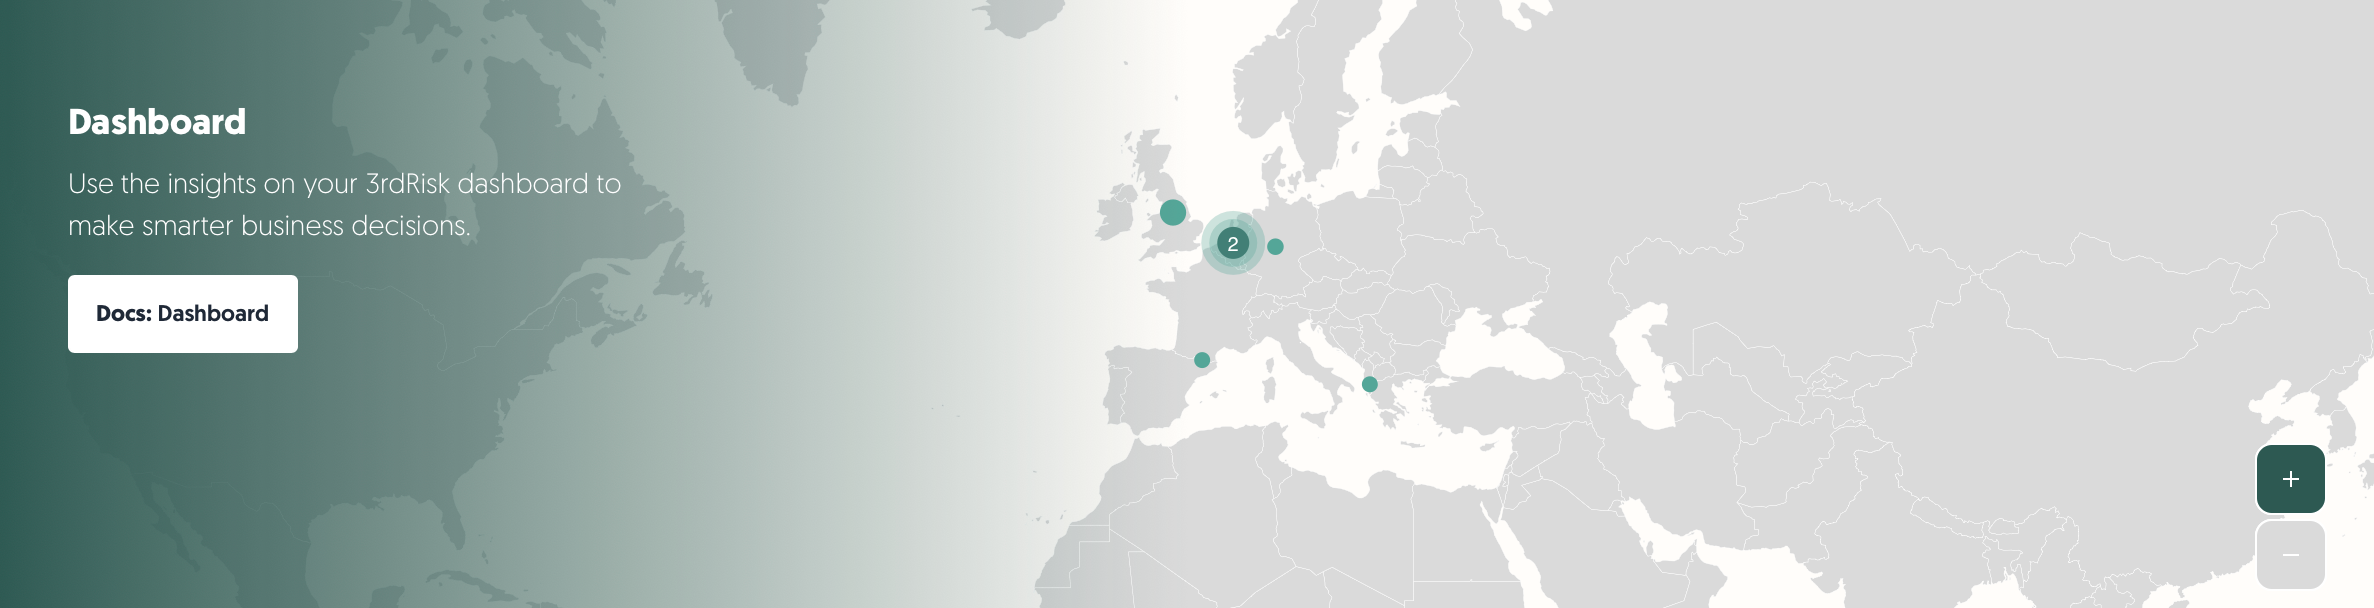
The world map at the top of your dashboard is a dynamic, interactive visualisation of the geographic distribution of all your active third parties. The "Country" field is used to determine a third party's location on the map. The following actions are available:
- Click on a country's circle marker, and you will be taken to the third party catalogue with filters enabled for that country and for the status "Active".
- A circle marker with a number inside of it represents multiple countries. Clicking on one of these circle markers with a number will zoom in to show you the countries separately on the map.
- Drag with your mouse to move the map around.
- Use the + / - buttons or the scroll-wheel to zoom in and out.
Senses & Integrations
The following senses and widgets are available for your integrations:
- Business Radar news monitoring: Shows you recent news items in which your organisation is mentioned. Click on the news item to read the news article. Articles presented in a red box indicate a negative news article.
Available from Insight plan. - Cybersecurity rating: Gives your organisation's cyber security score as rated by an external data provider (e.g. BitSight or Securityscorecard).
Available as add-on. - Credit rating: Gives the financial credit rating of your company as provided by the external data provider (e.g. Creditsafe), including an indication of the trend.
Available as add-on. - Sustainability score: Provides insight into your organisations sustainability rating as provided by your external data source provider.
Available as add-on.
Ecosystem
The new dashboard provides a crystal-clear, interactive overview, helping you focus on what truly matters—managing risk effectively, not hunting for information. Watch our product update video, or continue reading below to learn more.

If you do not see these widgets, you might be missing permissions to view the ecosystem dashboard. Please contact your administrators. If you are an administrator yourself, please check the permissions of your roles. Read more below under "Permissions".
Overview & Strategic Insights
View your ecosystem segmented by third-party types (vendors, suppliers, and other categories) and the amount of active contracts.
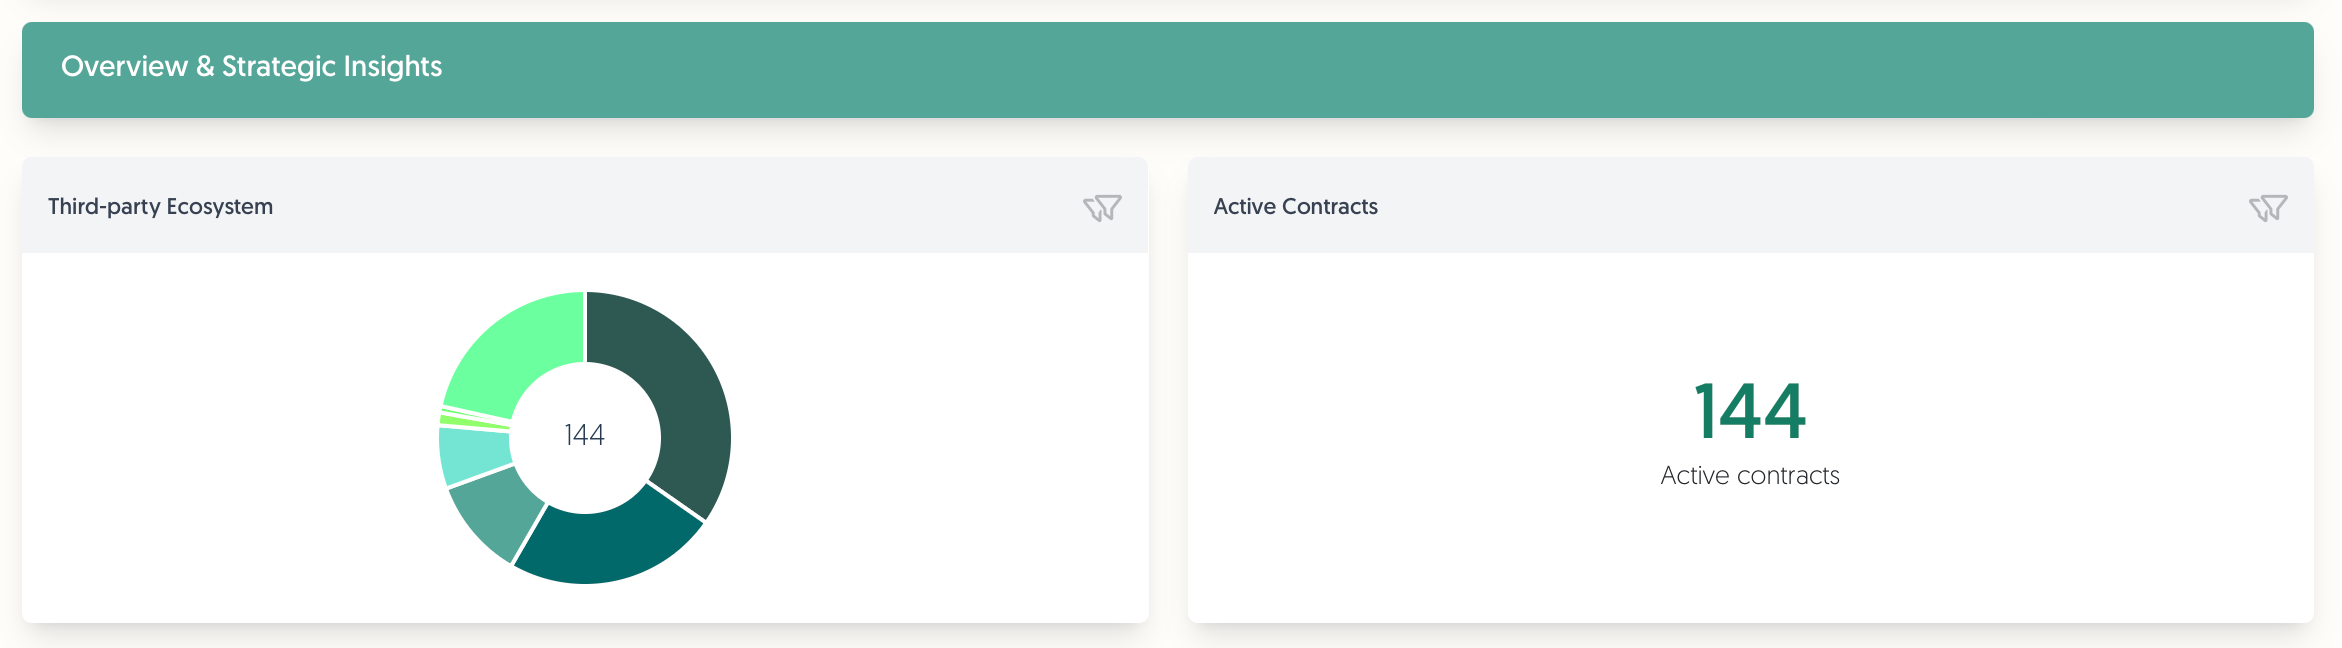
Third-party Ecosystem
- View your ecosystem segmented by third-party type.
- The number in the center represents the amount of third parties in your catalogue with the status active.
- Click on one of the slices to go to the catalogue, filtered by the selected third party type.
Active Contracts
- View the amount of active contracts in your contracts catalogue.
Only active contracts of active third parties are shown. - Click on the number to go to the contract catalogue, filtered by active contracts.
Risk Exposure & Issues
Monitor risk exposure and issues linked to your third parties.
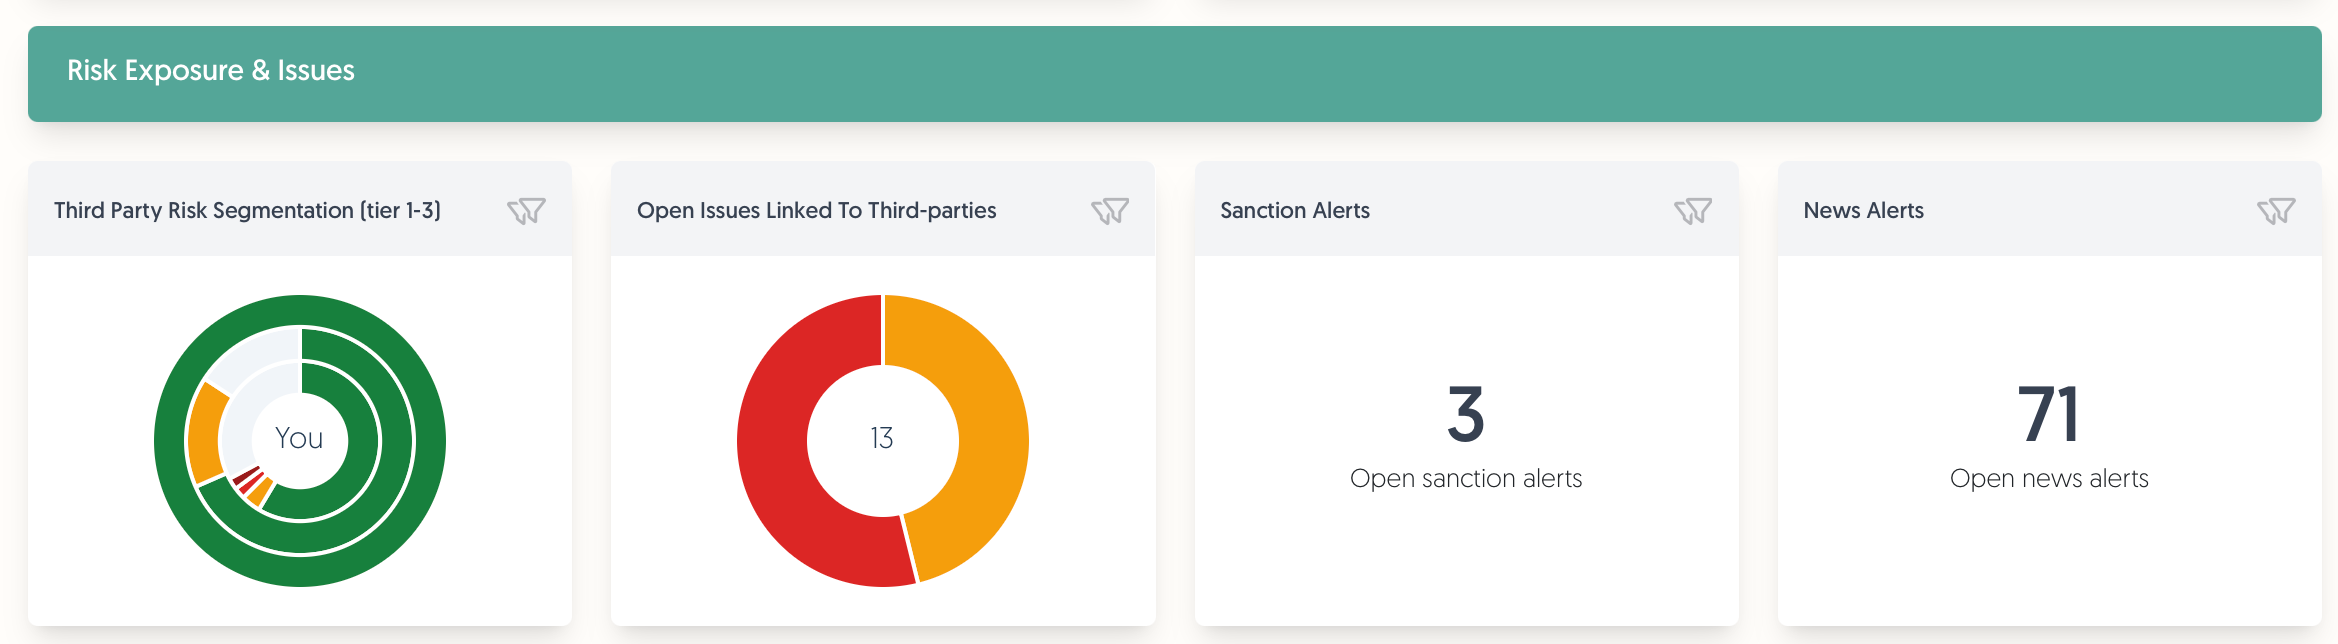
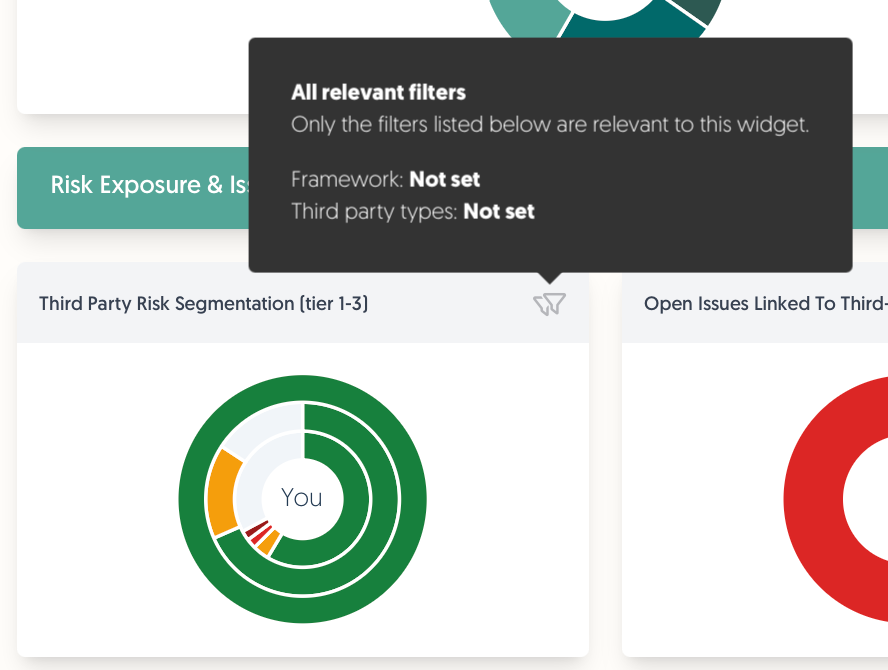
Third Party Risk Segmentation
- This widget shows your third parties in concentric rings representing tiers with the different colored slices indicating risk profile scores.
- You: Your organization is at the center.
- First ring: Tier 1 (direct partners) is in the first ring.
- Second and third rings: Tier 2 and Tier 3 third parties are in the second and third rings respectively.
If you do not see these outer rings, the widget could not find any tier 2 or 3 third parties. This can also be due to your active filters.
- Click on any segment to access the catalogue filtered by the selected tier and risk score.
Open Issues Linked To Third-parties
- Monitor open issues with segmentation by criticality level.
- Click to access the issues overview filtered by the selected criticality level.
This widget only shows issues linked to a third party. Other issues are not counted.
Sanctions Alerts
Available as add-on.
- View alerts from our sanctions monitoring add-on.
These alerts indicate there are sanctions for which no action has been taken yet in the platform. - Click to filter the catalog to find the third parties to which these alerts apply.
News Alerts
Available from Insight plan.
- View alerts from our Business Radar news monitoring integration.
These alerts indicate there are news items for which no action has been taken yet in the platform. - Click to filter the catalog to find the third parties to which these alerts apply.
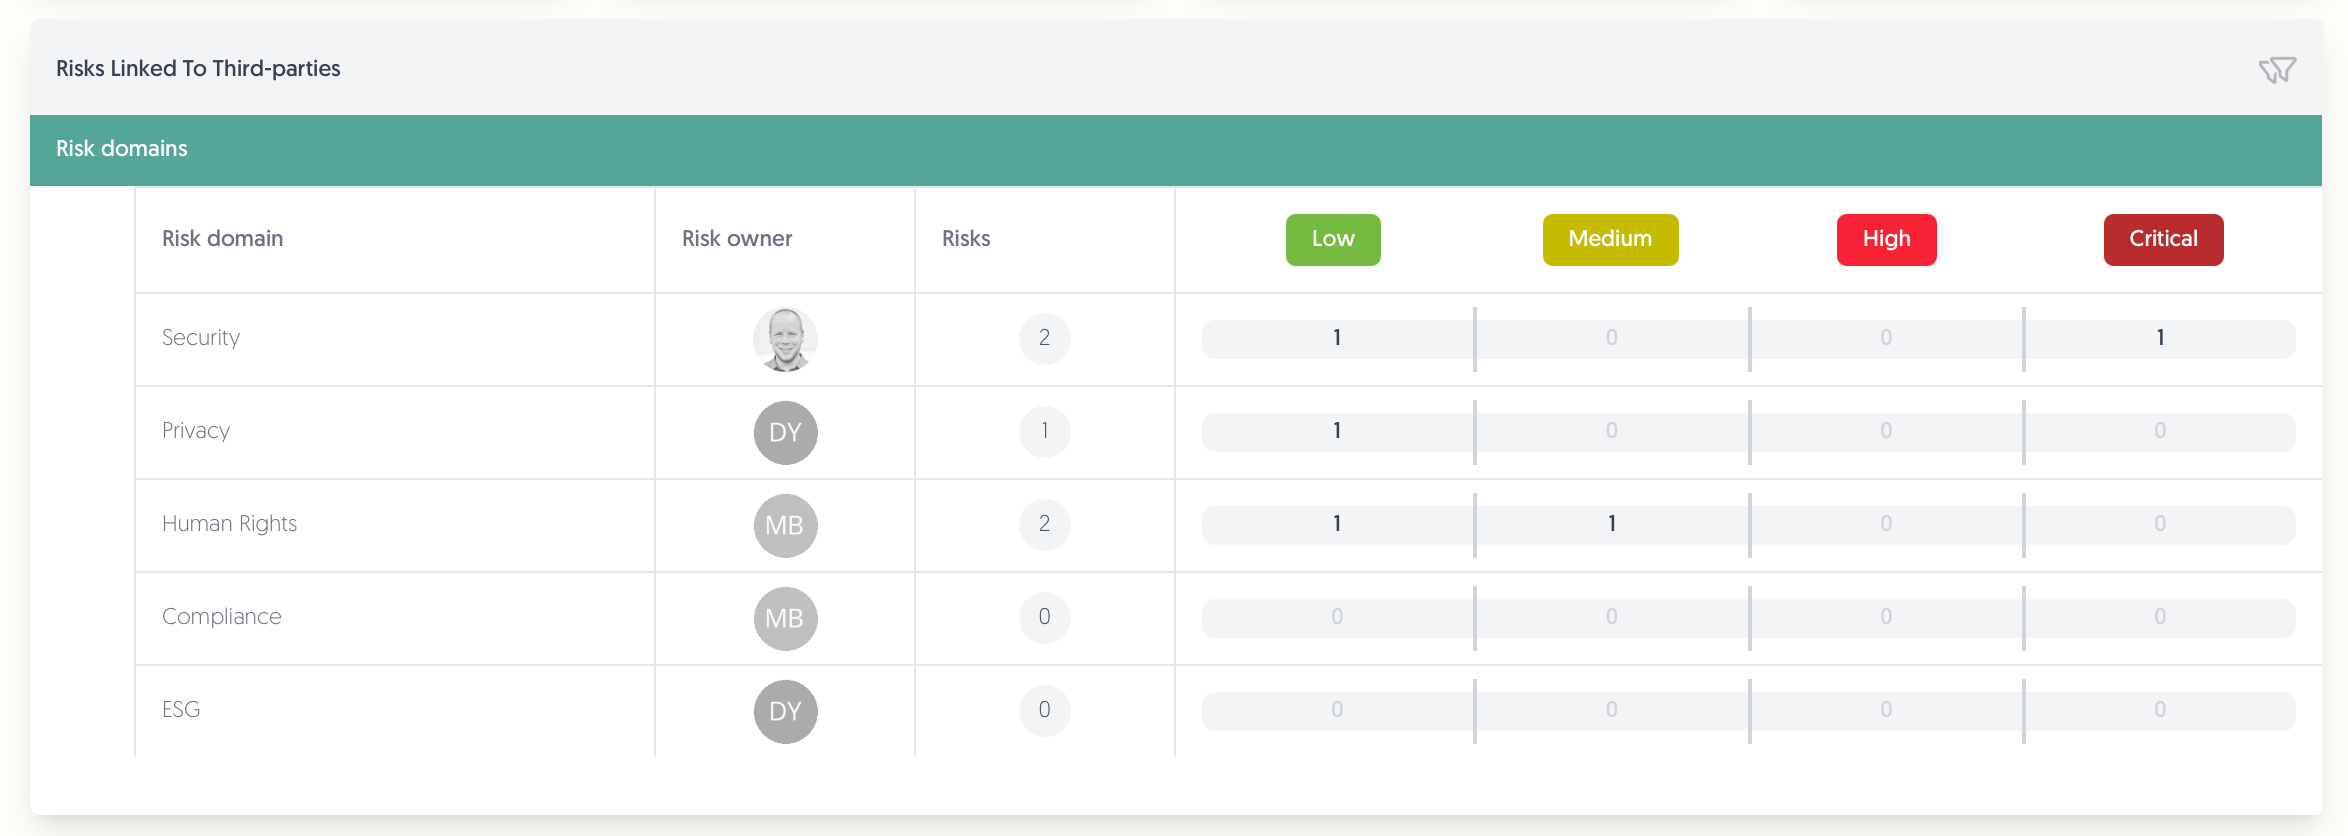
Risks Linked To Third-parties
Available from Manage plan.
- This widget contains comprehensive visualization of risks by domain, owner, and severity.
For a risk to show up in this widget, it must be an active risk, its risk domain's modules must include "Third-party", and the risk must be linked to a third party. - The risks are categorised by residual risk.
This uses the risk scores as setup in the risk management configuration by the administrators in your platform. - Click to open the risk register filtered by risks linked to active third parties and the selected risk score (if chosen).
Operational Metrics
Track your actionable ecosystem items like your action plans and assessments.
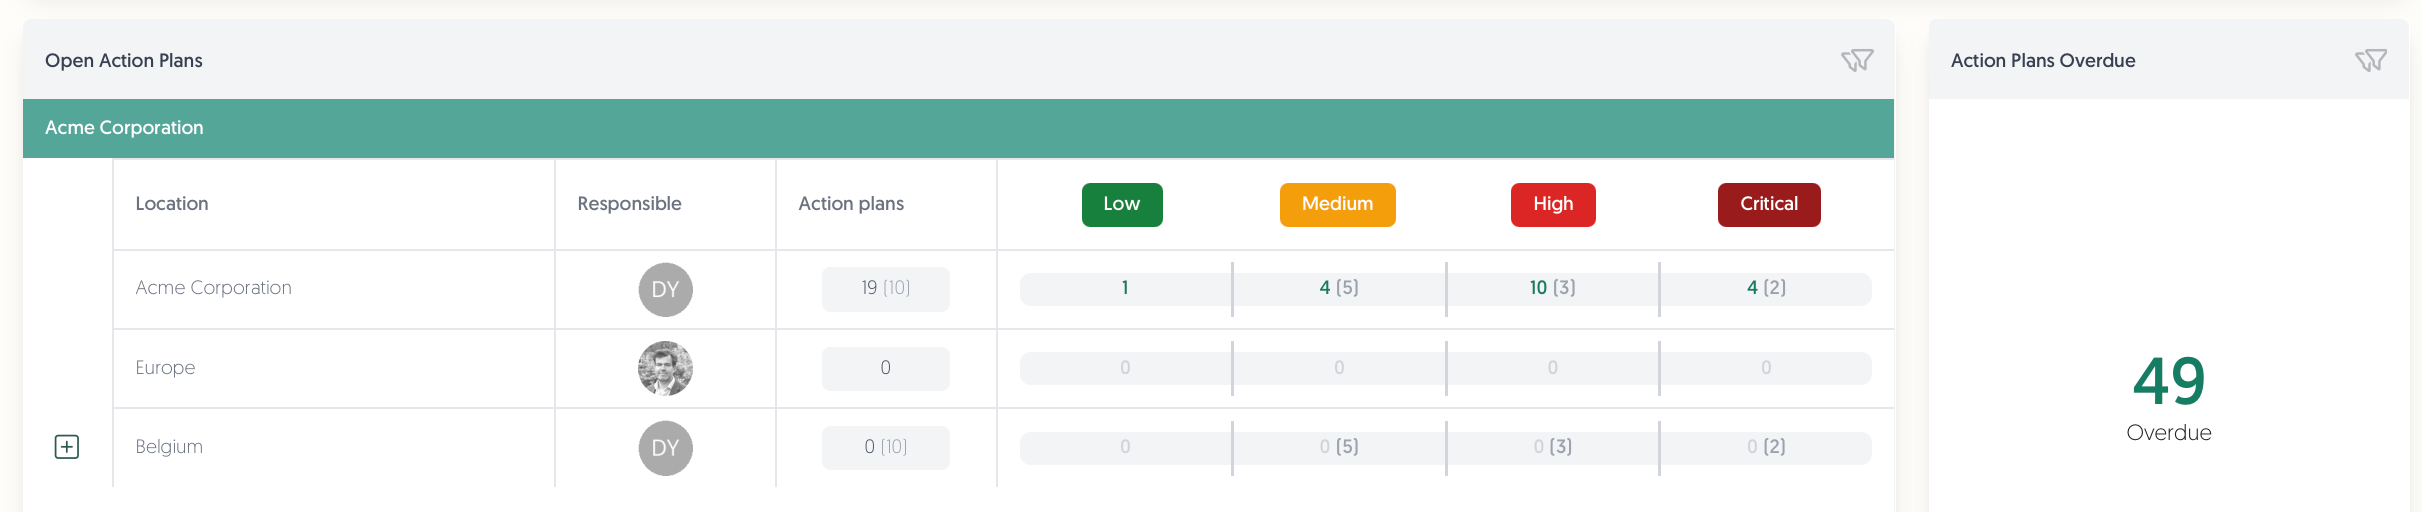
Open Action Plans
- Track open action plans by organisational location of the third party, based on your organisation model.
There are separate counts for that specific location's action plans (first number) and sub-elements' action plans (second number between brackets). - This widget is limited to open action plans linked to an active third party.
- Click to go to the action plans overview page filtered by action plans with an open status and linked to third party.
Action Plans Overdue
- Immediately view your overdue action plans using this widget.
- This only includes open action plans linked to an active third party.
- Click to go to the action plans overview page filtered by action plans that are overdue, open, and linked to a third party.
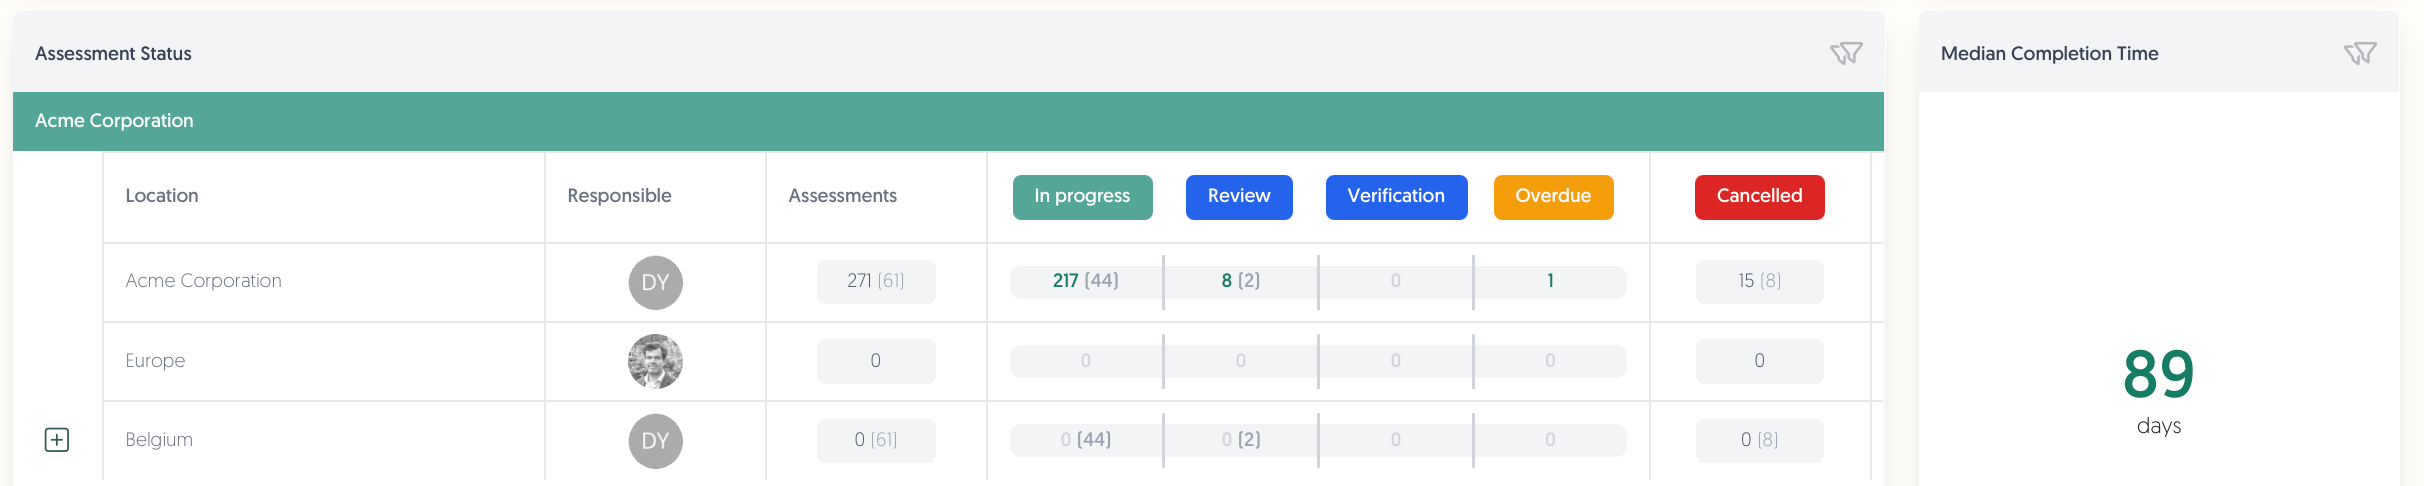
Assessment Status
Available from Insight plan.
- Track the status of your assessments, organised by organisational location of the third parties.
There are separate counts for that specific location's assessments (first number) and sub-elements' assessments (second number between brackets). - If you do not see all status columns (such as overdue, cancelled, and finished), the width of your window might be too narrow. Try scrolling to the right to view them all.
- Click to go to your assessments overview page, filtered by the chosen assessment status.
Median Completion Time
Available from Insight plan.
- This metric displays assessment speed: it tracks the median time from the moment your assessment is sent out to completion.
This means 50% of assessments take less than this amount of time, and 50% take longer than the median time. - This number is calculated using all finished assessments of all your active third parties.
Performance & Trends
Identify trends, track performance, and find outliers.
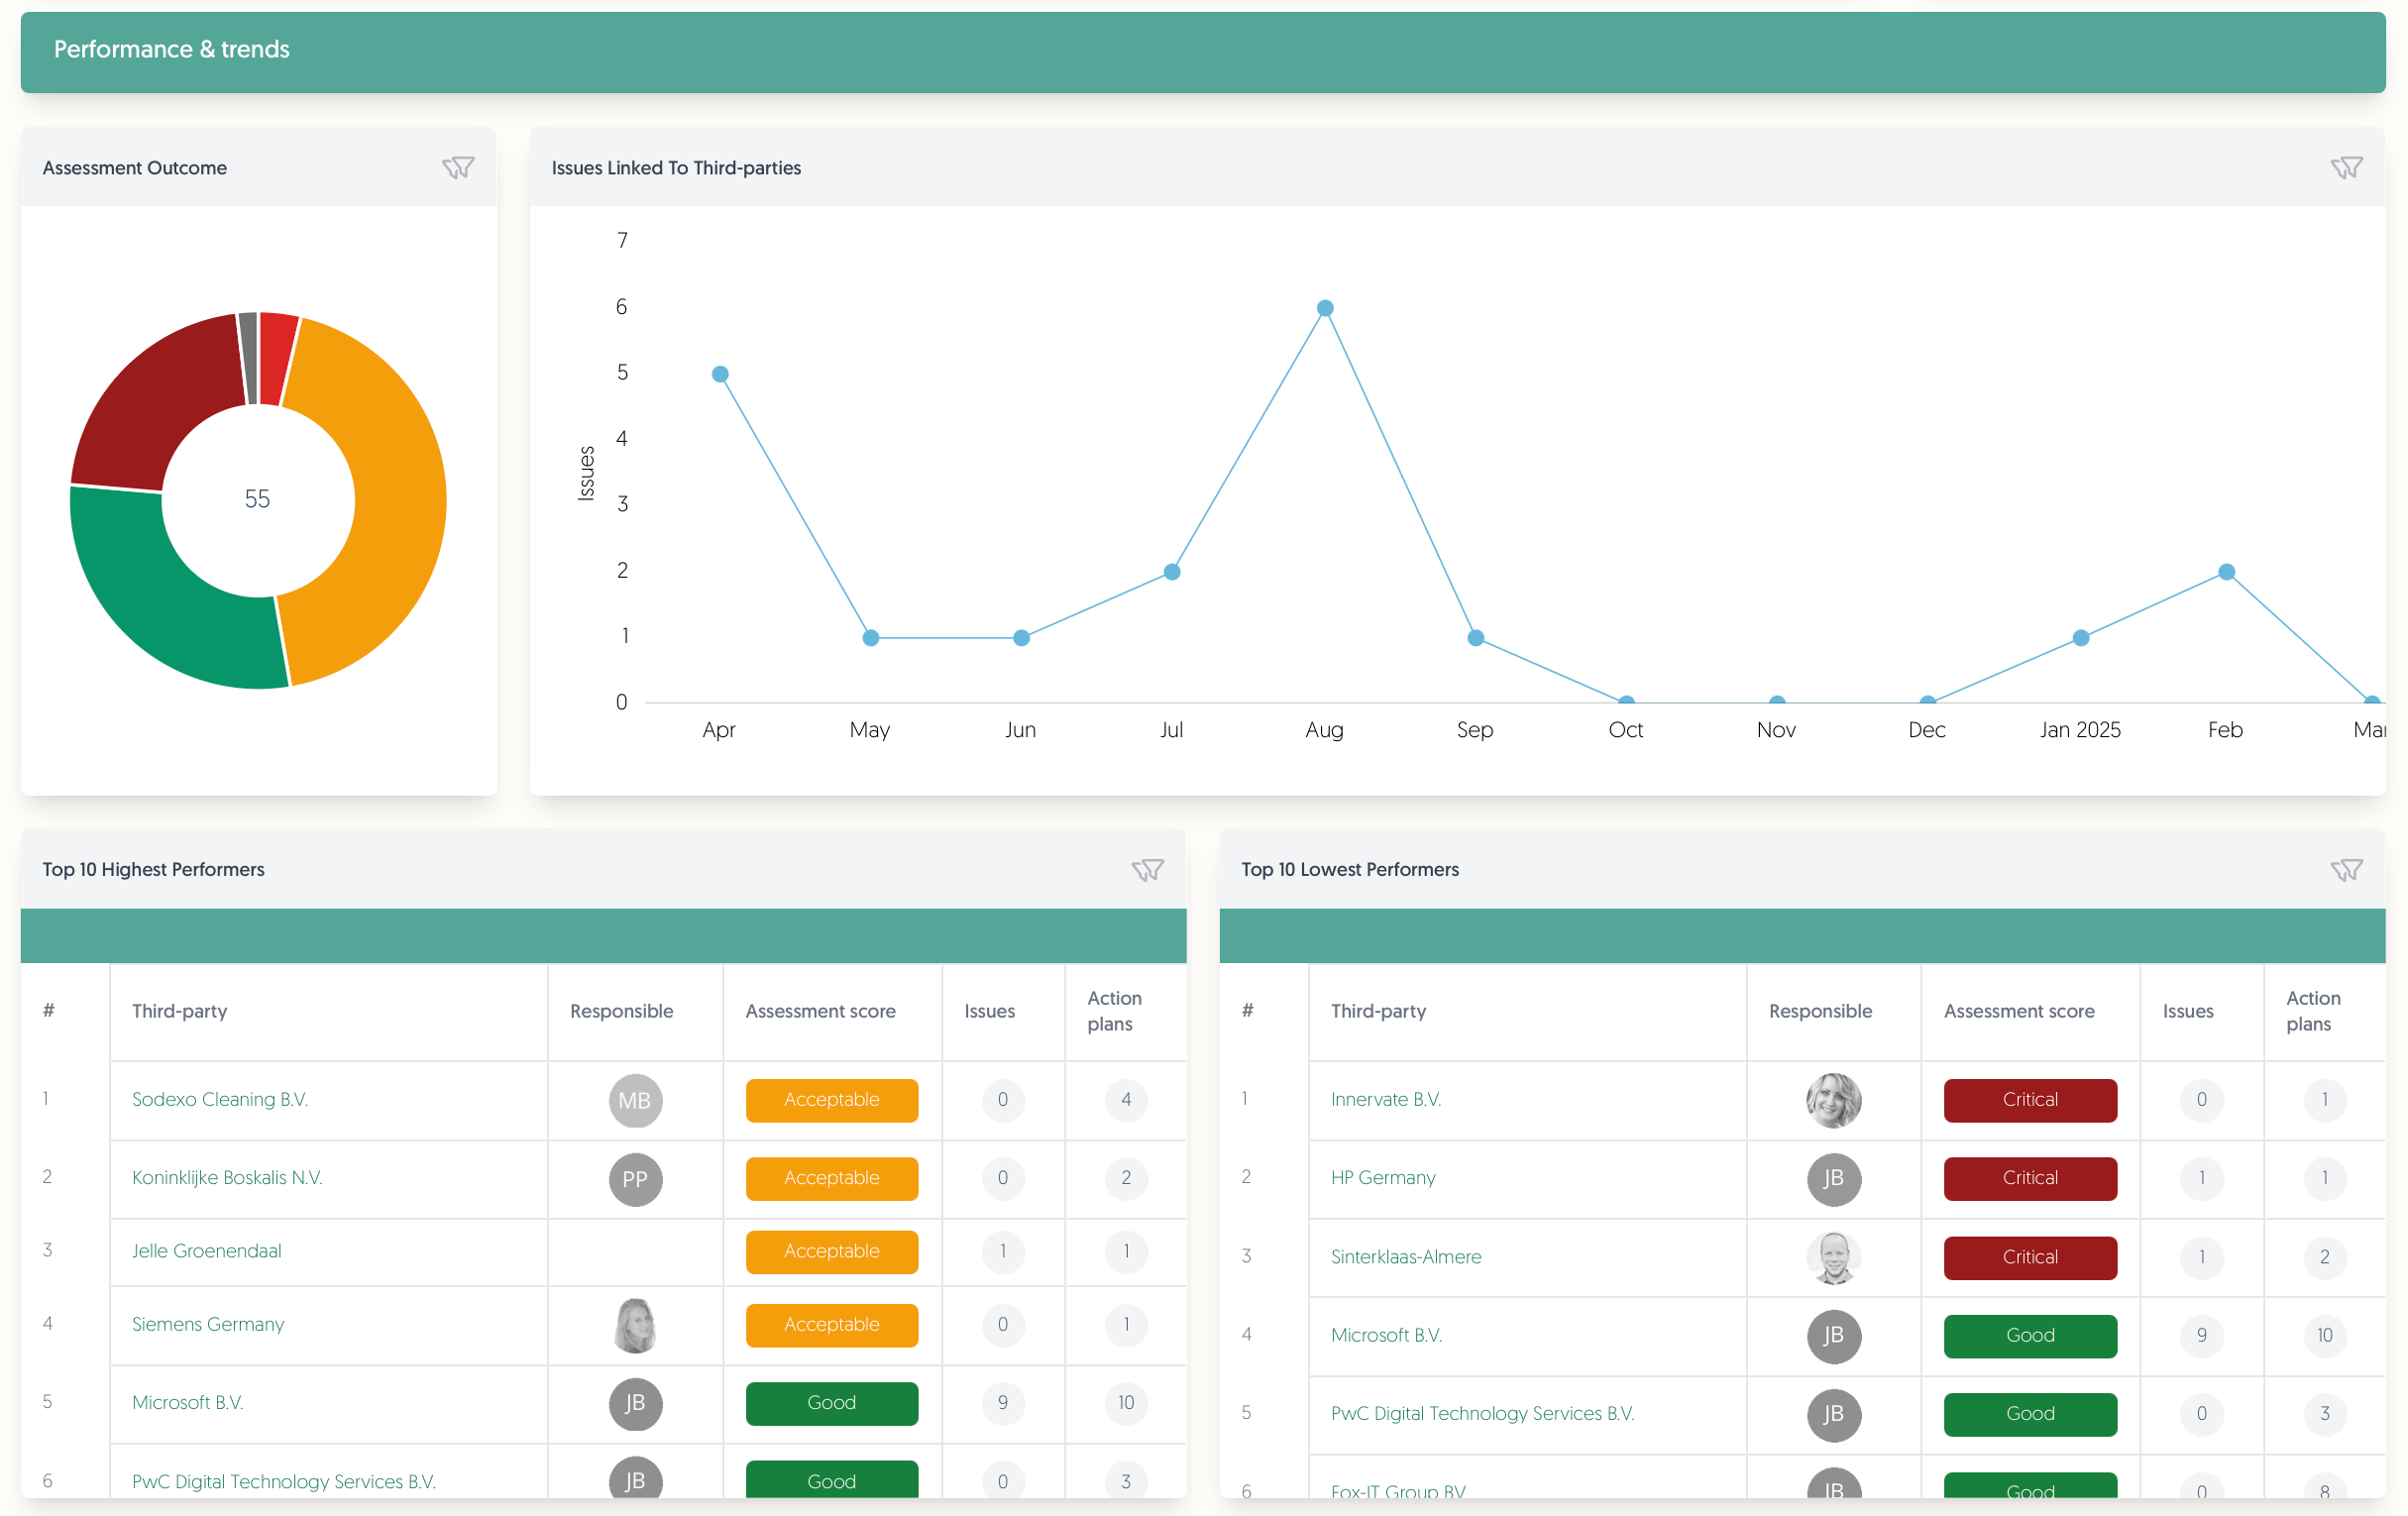
Assessment Outcome
Available from Insight plan.
- This widget shows the outcomes of all finished assessments ever performed for your active third parties.
This includes third parties that are not linked to any organisation element.
This does not include archived third parties, however. - Click to go to the finished assessments overview page filtered by the selected assessment result.
Issues Linked To Third-parties
- This graph shows the amount of issues linked to your third parties per month, based on the creation date of the issue.
- Click to filter the issues catalogue by the selected month and by issues linked to third parties.
Top 10 Highest and Lowest Performers
Available from Insight plan.
- View your best and worst performing third parties according to their most recent assessment result.
The list is sorted by assessment result.
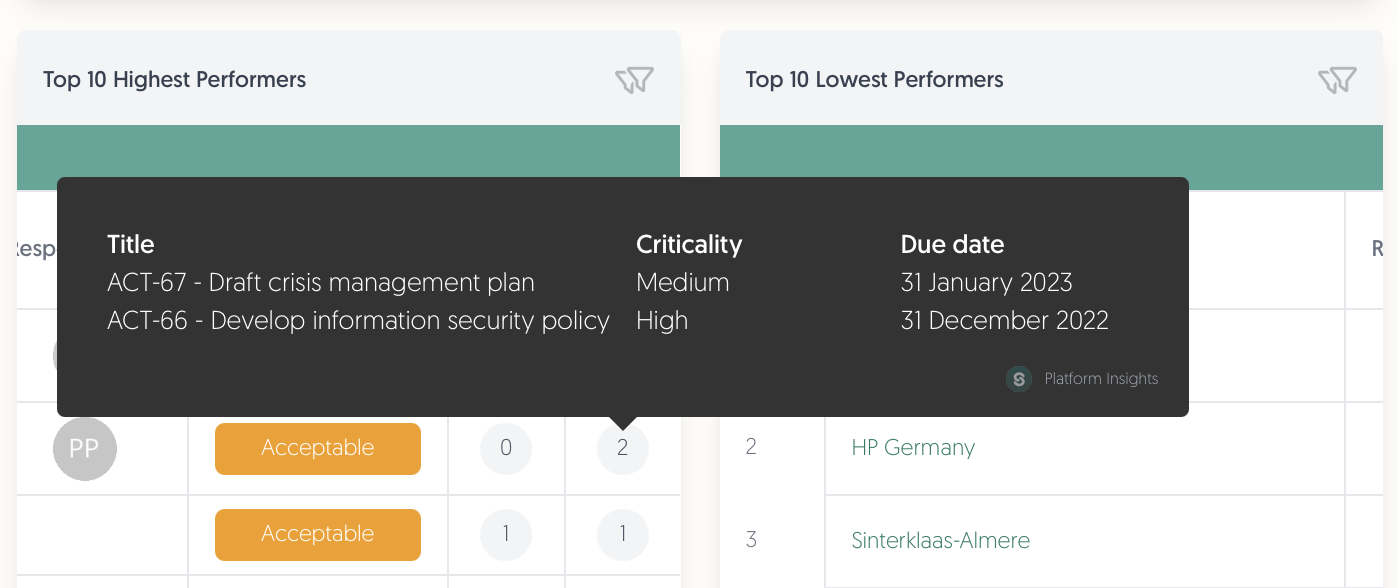
If you do not see all columns (such as issues and action plans), the width of your window might be too narrow. Try scrolling to the right to view them all. - Hover over the badges to view the third party's issues and action plans:
This only includes open and in progress issues, and open action plans.
Click on the badges to go to the issues / action plans catalogue filtered by that third party. - Click on the name, assessment result, issues count, or action plans count to go to their respective overview pages filtered by the selected third party.
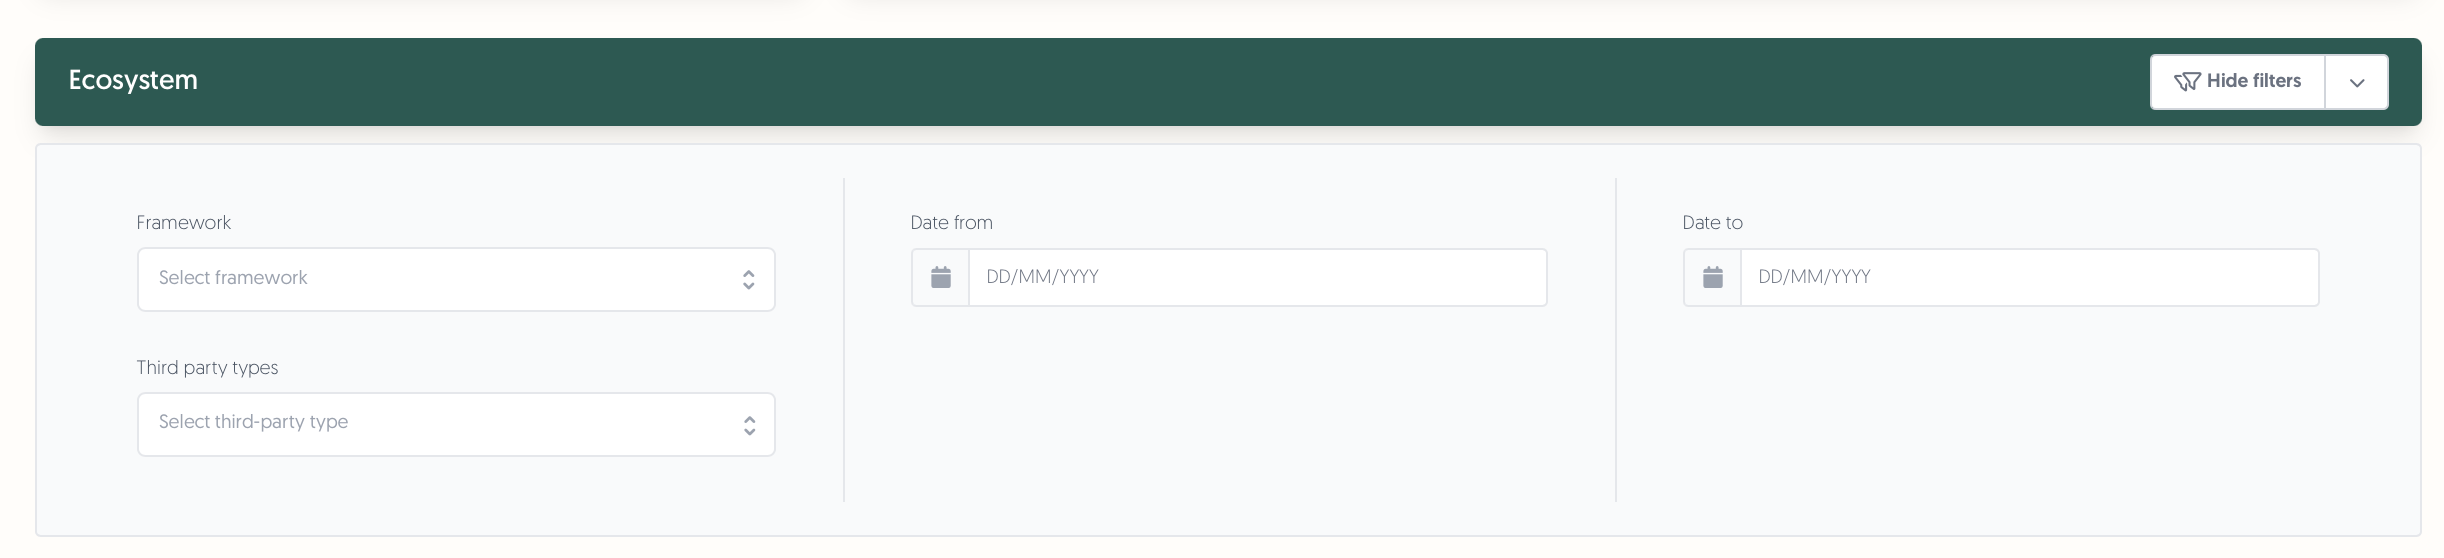
Filters
Customize your dashboard view with filters, including framework, third-party type, and date ranges. Simply hover over a widget’s filter icon to view what filters apply to it, as well as whether any of them are currently active.
Internal Control
Available from Manage plan.
Note: The information below does not apply to you if you are using the new internal control dashboard. Our documentation will be updated once it is out of preview and available to all users. Thank you for your patience.
The following widgets are available for internal control:
- High and critical risks: Shows the number of open risks with the residual risk rating high or critical. Click on the number to go to the risk register.
- High and critical incidents: Shows the number of open incidents with priority high or critical. Click on the number to go the incident register.
- Progress: Shows the percentage of self-assessments in each phase (testing, validation, verification, finished). Hover over to see the %. Click on a phase to get a list of the assessments that are in that particular phase.
- Performance: Shows the % of assessments per quarter and per framework section that have been tested with the testing result effective. Click on a 'dot' to get the assessments per framework section with the test conclusion not effective.
- Issues & Actions: Gives an overview of the open issues and associated open action plans.
- Reward and engagement: Shows an overview of colleagues that have performed best according to predefined performance indicators.
Permissions
This section is only applicable to administrators from the Manage plan.
For users to get access to ecosystem or internal control widgets, you must enable the correct permissions for their roles. By default, roles include widgets that align with available modules for that user. You can edit these permissions by following these steps:
- On the left-hand side of your screen, go to Configuration → Roles.
- For the role you want to enable/disable dashboard widgets, open the Actions menu and click Edit.
- For ecosystem widgets, scroll down to the "Ecosystem" section. You can enable/disable the "Read" permission per widget in this section.
- For internal control widgets, scroll down to the "Internal control" section. You can enable/disable the strategic, tactical, and operational dashboard sections here.
- For users part of the new dashboard experience, you can enable/disable the "Read" permission per widget in this section. This feature will be available for all internal control users in the future.
FAQ
I do not see certain widgets or dashboards.
Either your administrator has not given you the correct permissions for the widgets or dashboards you are missing, or these widgets are not available for your organisation. If you believe you should have access to the widgets, contact your administrator or supervisor. If you are an administrator on the Manage plan and up, check the permissions as explained above in the "Permissions" section.
The filters do not work.
It might be the case that the chosen filters do not apply to the widget you are looking at. Move your mouse over the filter icon in the top right corner of the widget to check what filters apply to that widget:
I am missing certain columns or information in the widgets.
The widgets oftentimes show a relevant subset of information, and not all your data. For example, the "Open Action Plans" widget only shows action plans with an "Open" status that are linked to a third party. Read more about each widget's specific filters in the article above.
If that has not answered your question yet, or you are missing a column and not specific information, please try scrolling to the right in the widget. If your window is too narrow, you might have to scroll to the right to view all available information in a widget.